Different instruments answer different questions
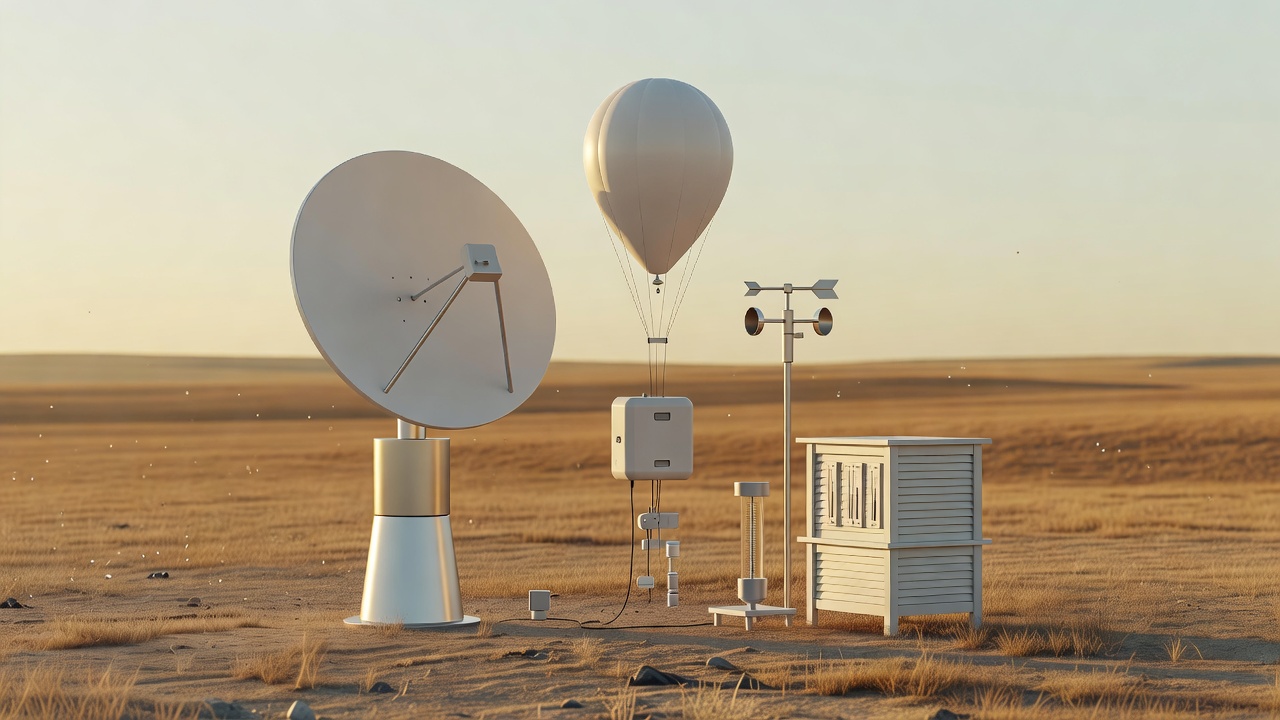
A surface station measures conditions at a particular place and exposure. A radiosonde carried by a weather balloon samples temperature, humidity, pressure and wind as it rises and drifts. Aircraft supply additional measurements along flight paths. Each observation has a location, time, uncertainty and representativeness: a sheltered sensor cannot automatically describe a whole valley or city.
Weather satellites provide broad coverage, including oceans and remote regions with fewer surface instruments. Visible imagery primarily records reflected sunlight, while infrared measurements can provide information about emitting temperatures and atmospheric layers. A bright-looking cloud top is not a direct measurement of rainfall at the ground. Retrieval methods translate radiances into useful geophysical estimates, with assumptions and limits.
Weather radar transmits energy and analyzes returned signals. Reflectivity helps characterize targets such as precipitation; Doppler information estimates motion along the radar beam. Dual-polarization variables add clues about particle shape and consistency. Beam height, terrain blockage, attenuation and non-weather targets can complicate interpretation. A colorful radar display is a processed measurement, not a complete map of every raindrop.
Constructing a consistent starting point
Numerical prediction requires a three-dimensional estimate of the atmosphere at an initial time. Data assimilation blends recent observations with information from a previous forecast, accounting for estimated errors. Quality control helps identify suspect measurements. The aim is not to copy every observation exactly, but to build a physically useful analysis from incomplete, sometimes conflicting evidence.
Unobserved regions still matter. A small error in the placement of a moisture boundary can influence where storms initiate. More observations often help, but their value depends on quality, placement and how they enter the analysis. A dense set of measurements of one variable cannot fully replace missing information about another.
Models evolve a simplified atmosphere
Numerical weather prediction approximates equations governing motion, mass and energy on a computational grid. Processes smaller than the grid spacing need additional treatment. Cloud microphysics, turbulence and interactions with the land surface introduce further choices and uncertainty. A finer grid can represent more detail, but sharper-looking output is not automatically a more accurate forecast.
Systems such as NOAA's Global Forecast System, the High-Resolution Rapid Refresh and the European Centre for Medium-Range Weather Forecasts' Integrated Forecasting System serve different scales and purposes. Their maps should be compared with attention to valid time, model cycle, resolution and variable definitions. A single dramatic panel taken out of that context can be misleading.
Why an ensemble is more than many maps
An ensemble explores multiple plausible evolutions by varying initial conditions, model formulations or both. The distribution can reveal competing scenarios that a single forecast conceals. If members disagree about a storm's track, the spread is information about uncertainty, not simply a contest to choose the most appealing outcome.
Ensemble members are not perfectly independent samples, and the atmosphere can evolve outside the range they represent. Probabilities may require calibration against past performance. A reliable forecast that assigns a 30% probability to a defined event should, across many comparable forecasts, see that event occur about 30% of the time. That statement concerns repeated performance, not a partial event on one particular day.
Interpret the event definition
A probability is incomplete without knowing the event, area and time period. A point precipitation probability is not automatically the fraction of the day that will be wet or the fraction of a region receiving rain. Severe-weather outlook probabilities use their own definitions. Read the product explanation rather than transferring an interpretation from a different map.
For very short lead times, nowcasting combines recent observations, extrapolation and rapidly updated guidance. Human forecasters assess trends, model biases and local effects. A changed forecast can be evidence that new observations have narrowed the possibilities. Its usefulness should be judged against what was knowable at the time, not solely against hindsight.
Turn uncertainty into a sensible reading habit
Check the issue time and valid period, use the official source for your location, and look for changes in timing, coverage and confidence. Extreme rainfall, winter storms and tropical cyclones all have multiple hazards; one headline number rarely captures the full risk. Follow official warnings and local emergency instructions for decisions. This site explains the system behind those products, rather than replacing them.